
Sales Analytics in Retail BI
How sales analytics helps manage a retail business
Sales analytics is one of the core management tools in retail. It is not enough to look only at total revenue for a day, week, or month. A retail company needs to understand which stores, categories, products, brands, channels, and periods are driving results, where deviations appear, which items are gaining momentum, and which are starting to lose demand. That is why sales analytics is no longer an optional reporting feature. It is a fundamental part of retail management.
Retail BI on the Finoko platform helps companies build a unified sales analysis system for retail operations. The platform consolidates data from multiple sources, creates a transparent KPI model, and gives management a clear view of the business through dashboards and reports. As a result, sales analytics becomes a working management tool for owners, commercial directors, finance teams, category managers, and store managers.
In a competitive European retail environment, this matters even more. Retailers operate across multiple formats, regions, and customer segments, while demand patterns can shift quickly due to seasonality, promotions, tourism flows, inflation pressure, and changing consumer preferences. A strong sales analytics system helps businesses react earlier and manage performance with greater precision.
What problems sales analytics solves
Many retail companies already have revenue data, but that alone does not support effective management. The main issue is that performance data is often spread across separate systems and reviewed manually, which makes it difficult to build a complete and timely picture. Executives may see total turnover without understanding which categories are truly generating growth. Commercial teams may track product groups but miss structural shifts in demand. Finance teams may receive final numbers without enough visibility into the reasons behind deviations.
Without a strong sales analytics system, retailers face several common problems:
- Sales may decline gradually in individual stores, regions, or categories without being noticed in time.
- Some products may generate volume while displacing more profitable or strategically important items.
- Promotions and discounts may increase turnover but reduce revenue quality and distort performance assessment.
- Management may see network-level results while missing local weaknesses inside specific stores, assortments, or territories.
In this situation, decisions are often made too late. By the time a problem becomes visible in overall financial results, corrective action is usually more expensive and less effective. Sales analytics helps shift management from retrospective review to proactive control.
This is why sales analytics is relevant not only for large retail chains, but also for medium-sized retailers. A company with ten stores, fifty stores, or several online and offline channels still needs to understand where results are created, where they weaken, and how customer demand is evolving.
What sales analytics in Retail BI makes possible
Sales analytics in Retail BI on the Finoko platform allows companies to analyse revenue and related indicators across the dimensions that matter most in retail. A retailer can evaluate performance by store, city, region, format, category, brand, SKU, sales channel, customer segment, and reporting period.
The system supports analysis not only of revenue, but also of the drivers behind revenue formation. This makes sales analytics more useful for operational and strategic decision-making. Management can distinguish between sustainable growth and short-term effects. Commercial teams can assess category behaviour faster. Store managers gain a clearer understanding of the performance of their own location.
Retail BI can support analysis of indicators such as:
- revenue by store, region, and channel
- number of transactions and average basket value
- sales dynamics by period
- category and assortment structure
- demand shifts by product group or brand
- contribution of individual stores or categories to total sales
One of the most important advantages is that sales analytics in Retail BI is built within a single management framework. This means all departments work with aligned KPIs and shared calculation rules. As a result, companies reduce disputes over numbers, minimise manual reporting work, and improve trust in data across the business.
For European retailers, this unified model is especially valuable when data comes from different systems such as POS platforms, ERP, finance software, e-commerce tools, loyalty systems, and spreadsheets prepared locally by individual teams. Retail BI helps bring those sources together into one coherent management view.
How sales analytics helps identify growth opportunities
For a retail company, it is not enough to record current results. The real management value comes from understanding where growth opportunities exist. This is where sales analytics delivers practical benefit. The system helps reveal which stores are developing faster, which categories strengthen overall results, which products generate stable demand, and which items are starting to lose momentum.
This level of visibility allows management to act faster. A retailer can adjust the assortment in time, strengthen successful product groups, review promotional mechanics, work with stores that are lagging behind, and better interpret changes in customer behaviour. In this way, sales analytics becomes a tool for finding growth reserves rather than only a way to review historical data.
This is particularly important in European retail, where performance often differs significantly by country, city, or store format. A city-centre convenience store, a suburban supermarket, and an online channel may all show different demand patterns even within the same retail group. Sales analytics helps management avoid overly general conclusions and instead make decisions based on local and category-specific performance.
Why sales analytics is valuable for the business
The practical value of sales analytics lies in making retail management more accurate, faster, and more transparent. Instead of relying on isolated reports, management gains access to one shared picture of the business. This is critical in retail, where changes in demand, sales structure, promotion effectiveness, or store performance can quickly affect financial results.
For the business, this creates several important effects:
- faster management decisions because key data is already consolidated and visualised
- stronger control over stores, categories, brands, and product groups
- lower dependence on manual reports and disconnected spreadsheets
- better alignment between commercial, operational, and finance teams
At company level, this leads to better revenue management, a more accurate understanding of demand structure, and stronger decisions on retail network development. That is why sales analytics should not be treated as a separate reporting block. It should be part of the company’s broader performance management system.
It also improves management discipline. When the same indicators are reviewed regularly and consistently, the business starts to react to deviations sooner. This helps reduce blind spots in store operations, category performance, and commercial planning.
Why Retail BI is more effective than fragmented reports
Separate exports and local spreadsheets rarely provide enough transparency. They may show individual parts of the picture, but they do not support a systematic management approach. Retail BI on the Finoko platform solves this differently. Sales analytics is embedded into a broader management reporting environment where metrics can be compared, tracked over time, and used for regular performance control.
This approach helps a retailer do more than collect data. It turns data into a real management tool. Instead of spending time assembling reports manually, teams can focus on interpreting results, identifying risks, and acting on opportunities. That improves management quality and helps the company respond faster to changes in the retail market.
A modern retailer needs not only visibility into what has already happened, but also a reliable basis for daily and weekly management decisions. Retail BI supports that need by creating a structured environment for continuous sales monitoring and analysis.
Why choose Retail BI for sales analytics
Retail BI on the Finoko platform helps transform sales data into a clear and practical management system. A company gains transparent analysis of revenue, sales structure, demand dynamics, and store performance in one environment. This makes sales analytics suitable for regular operational use rather than only for occasional reporting.
If a retailer wants to see not only total turnover, but also the reasons behind change, the sources of growth, and the weak zones inside the business, sales analytics in Retail BI becomes an essential foundation for improving performance. It helps management move from fragmented observation to consistent control and from delayed reaction to data-driven decision-making.
For retailers working in a complex multi-store or multi-channel environment, this is not just a reporting improvement. It is a management advantage that supports stronger commercial decisions, better coordination across teams, and more sustainable business growth.
Send us your application and we will get back to you within one business day.
Peak sales hours
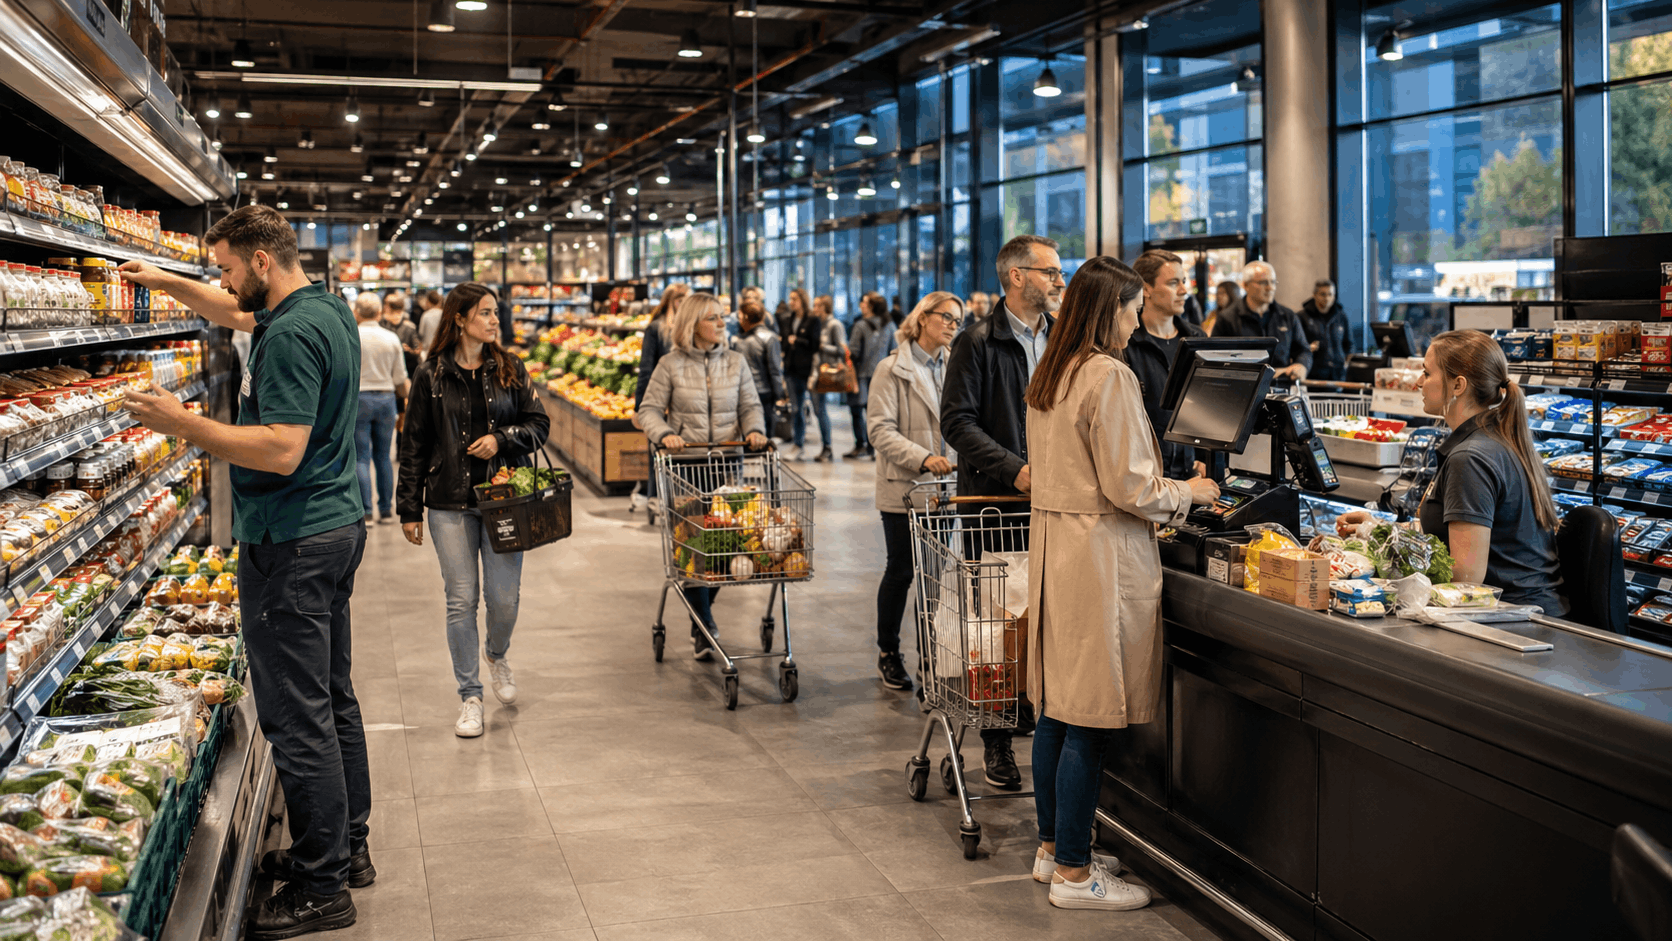
Peak sales hours as a retail management indicator Peak sales hours are the periods within a trading day when a store, sales channel, or retail network receives the highest commercial…
Sales growth rate
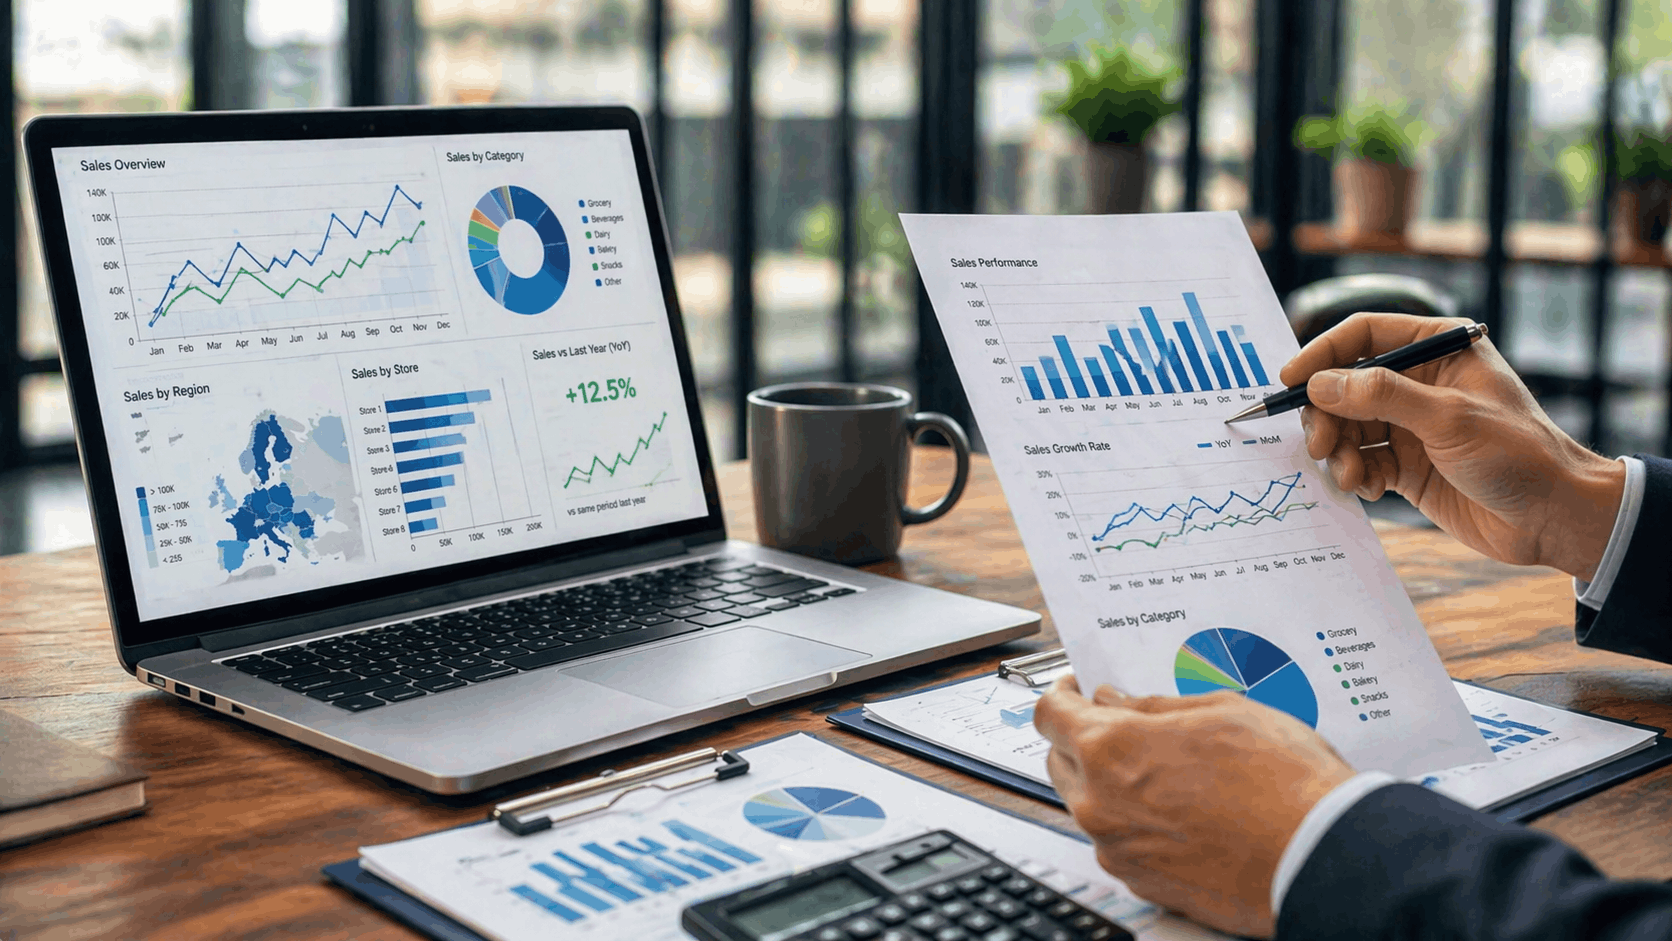
Sales growth rate is one of the most important indicators in modern retail management. It allows businesses to move beyond static revenue figures and focus on dynamics, trends, and performance…
Revenue per visitor
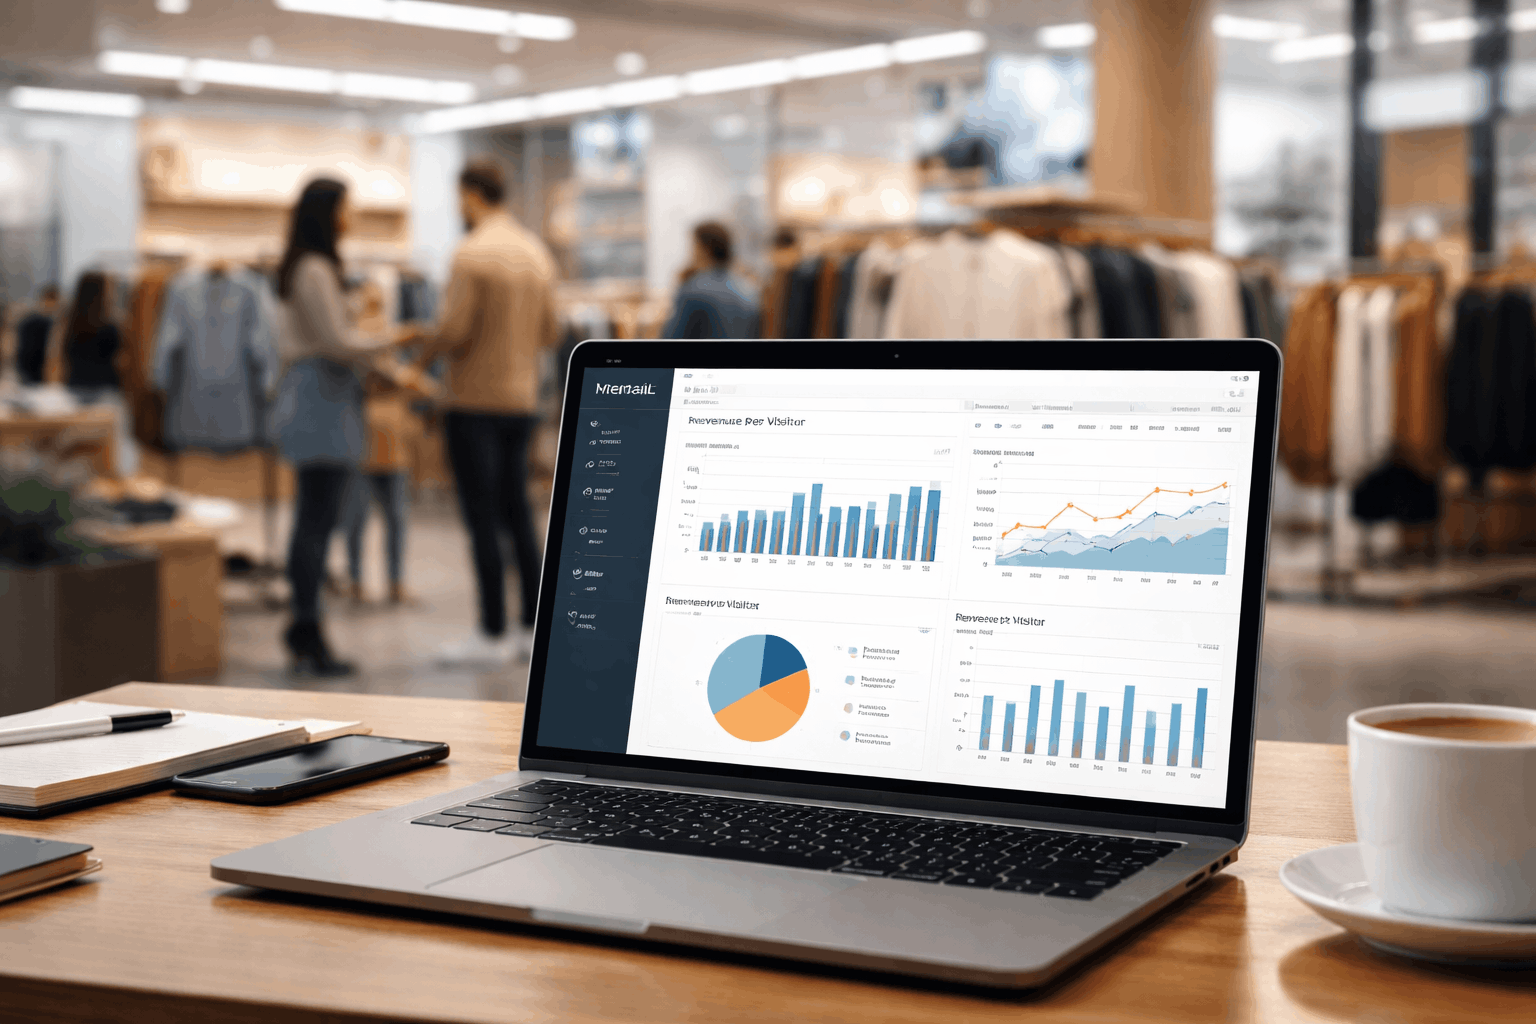
Revenue per Visitor as a Core Retail KPI Revenue per visitor is one of the most practical indicators of retail efficiency because it directly links store traffic with financial output….
AI Demand Forecasting in Retail
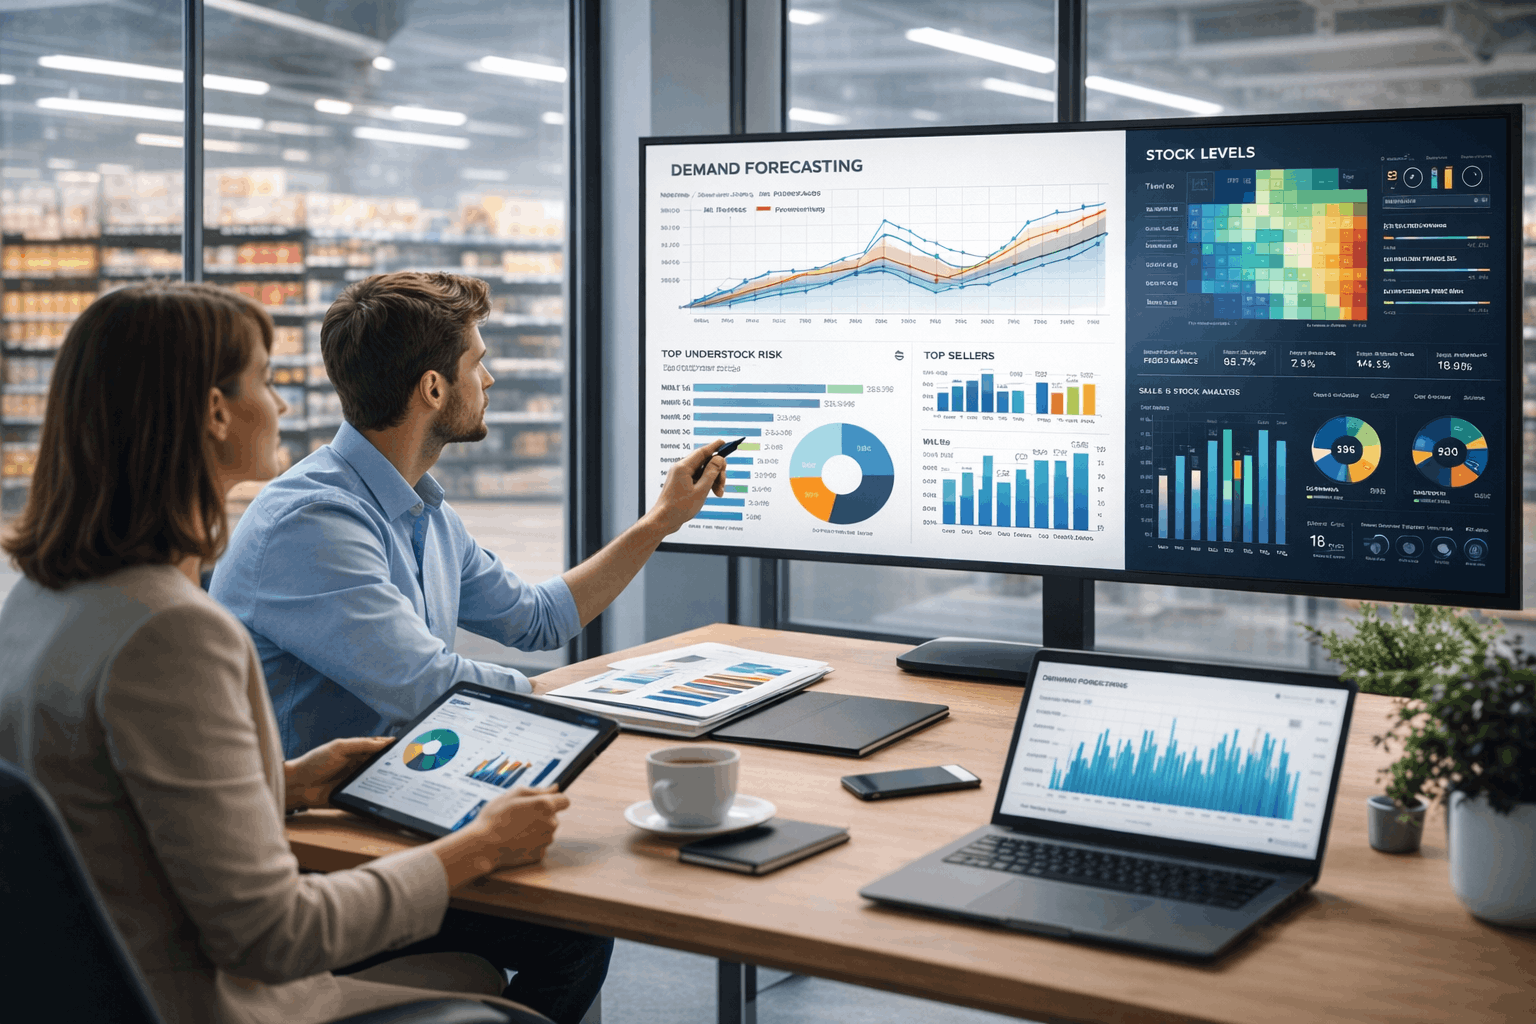
AI in retail is no longer limited to experimentation or advanced analytics teams. It is becoming a practical management tool for commercial directors, category managers, supply chain teams, and store…
Sales Per Square Meter
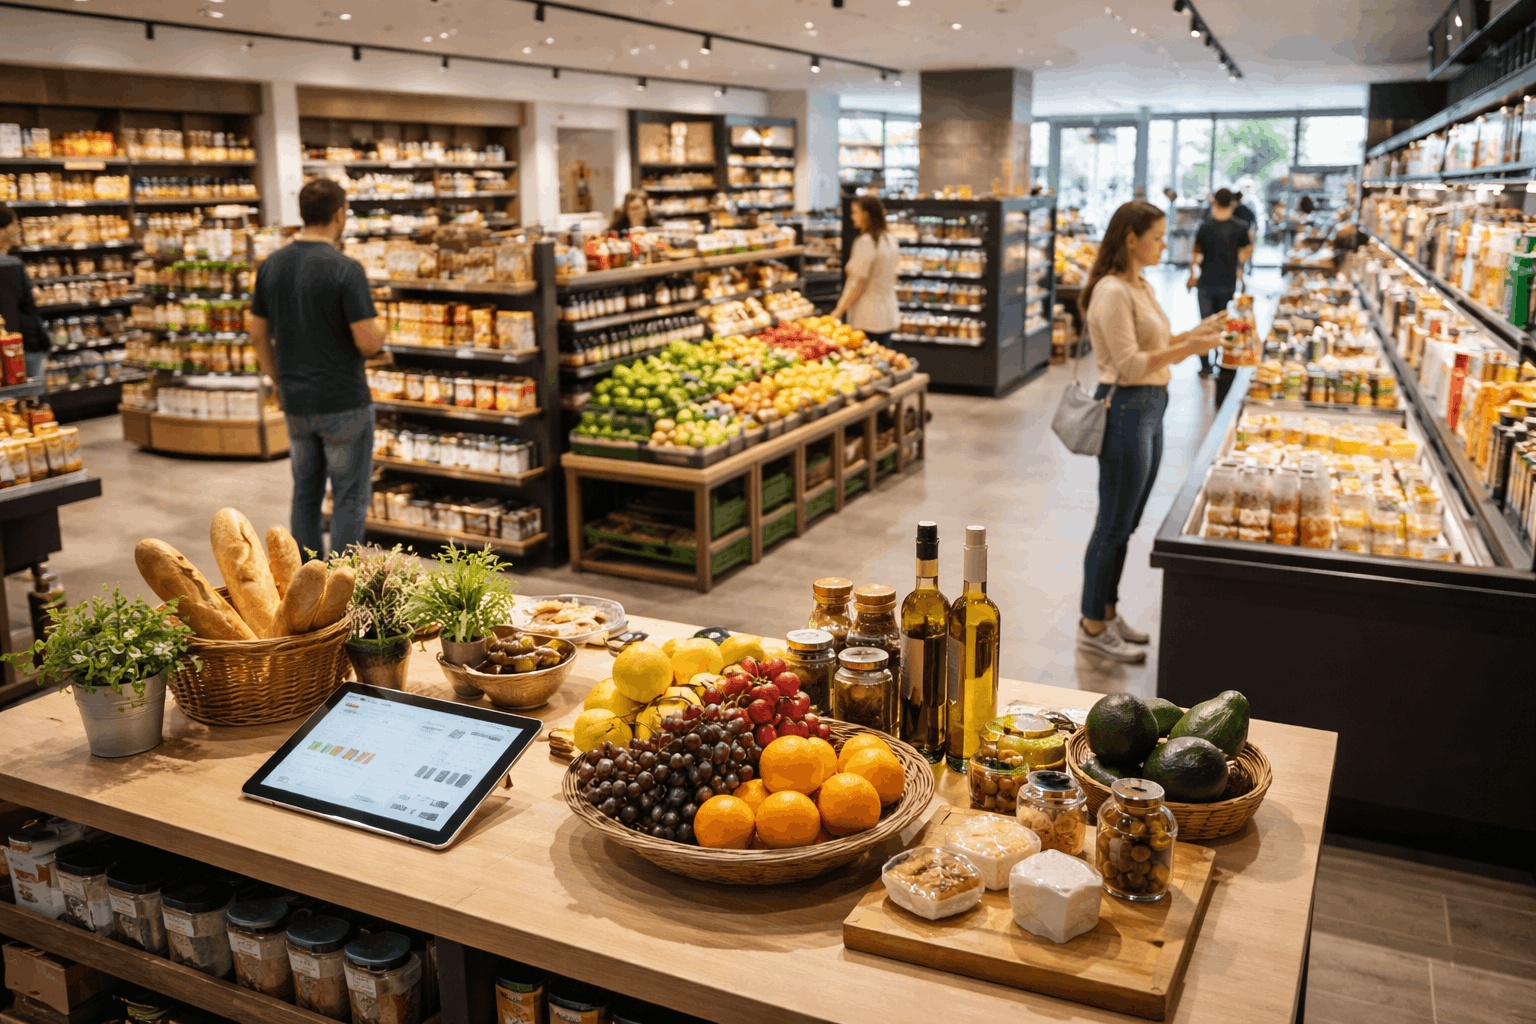
Sales Per Square Meter: How to Measure Store Space Efficiency in Retail Sales per square meter is one of the most practical indicators for evaluating store performance in retail. It…
Sales by day of week
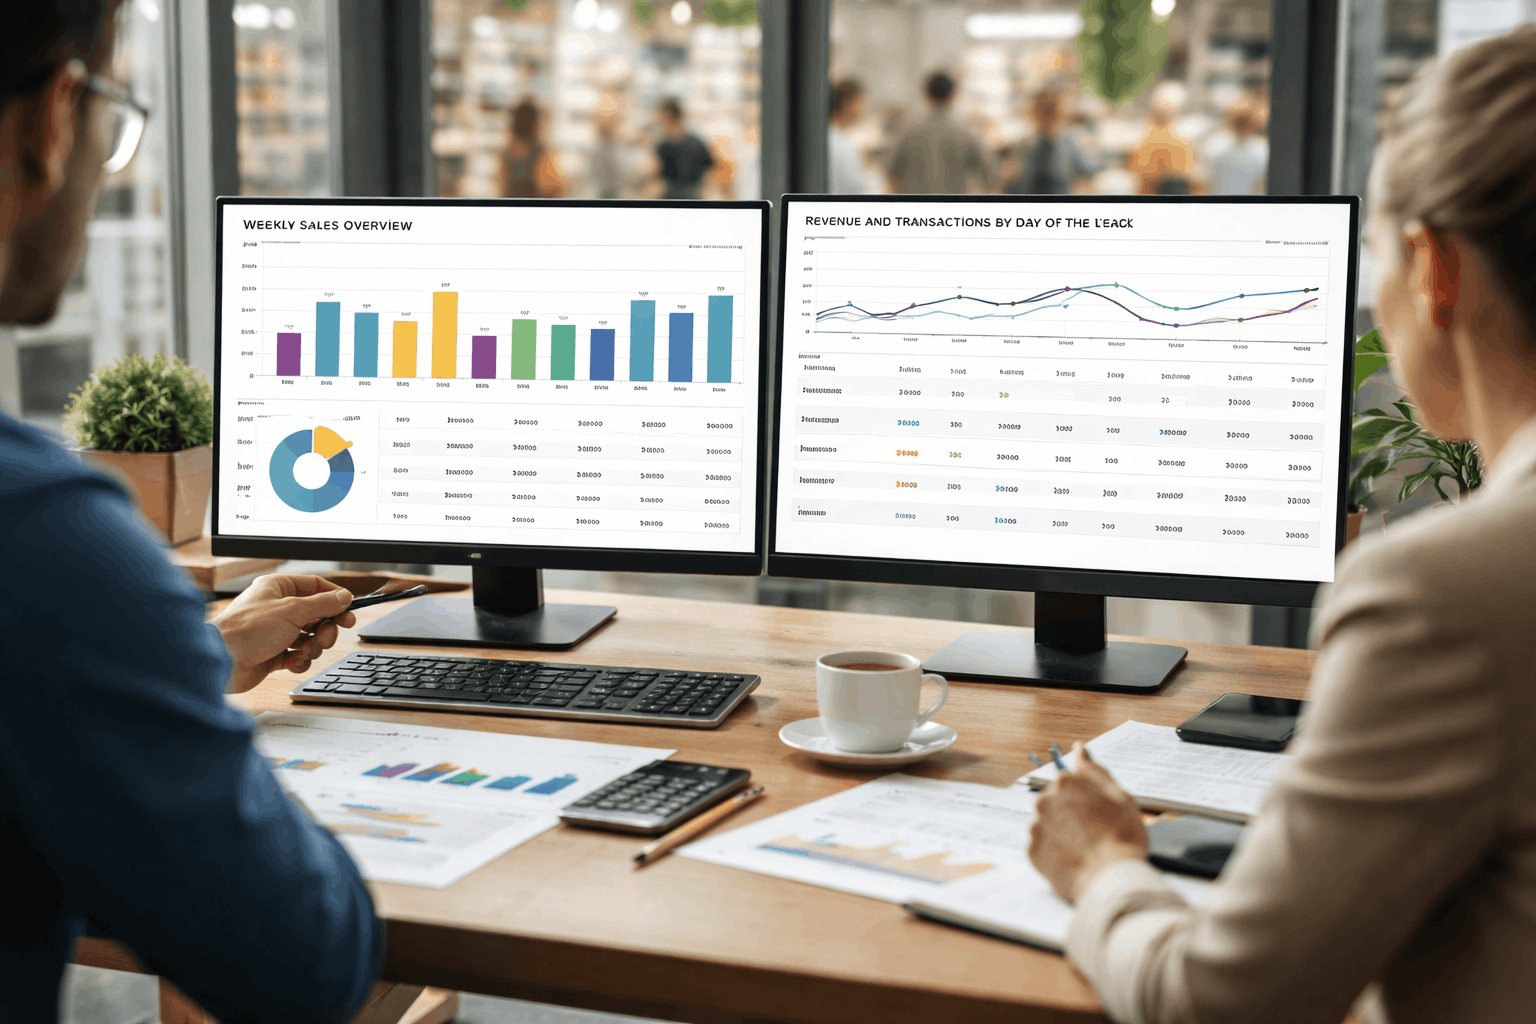
Sales by Day of Week: How to Turn Weekly Demand Patterns into Better Retail Decisions Sales by day of week is one of the most useful dimensions in retail analysis…